Key Findings: BTC Technical Analysis
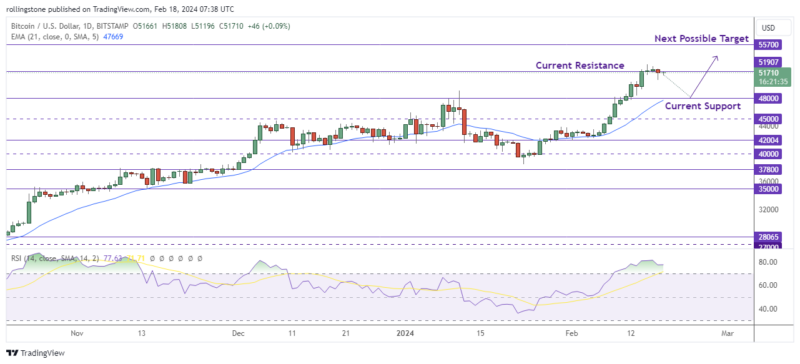
- Bitcoin price is testing the long-term resistance at $51,907 following a solid bullish momentum.
- The intermediate trend is still bullish despite the possibility of a drop as the price hits the overbought region.
- BTC/USD might retrace to $48,000 before rallying toward the $55K level.
Bitcoin Technical Analysis – BTC Daily Price Chart

Bitcoin price has attempted thrice to break beyond the upper limit of the long-term resistance, which is currently at $51,907. However, the attempts have been in vain, most likely due to buyer fatigue, as the Relative Strength Index (RSI) position above 70 indicates that BTC is already overbought.
Weekends typically see low trading volumes. Thus, higher volatility might cause the bitcoin price to plummet to the $48K support level. In the worst scenario, the decline might reach $46,760, the point where the upper supply zone boundary and the channel’s midline converge. A closure and break below this order block’s midline at $45,554 would validate the fall’s extension.
On the other hand, given the green volume bars within positive territory and the continued strength of the bulls in the BTC market, the price of Bitcoin may break through the $53,000 barrier. In an extremely optimistic scenario, the gains might increase by 5% to $55,700.
See Related: Bitcoin, Ethereum Technical Analysis
Key Findings: ETH Technical Analysis
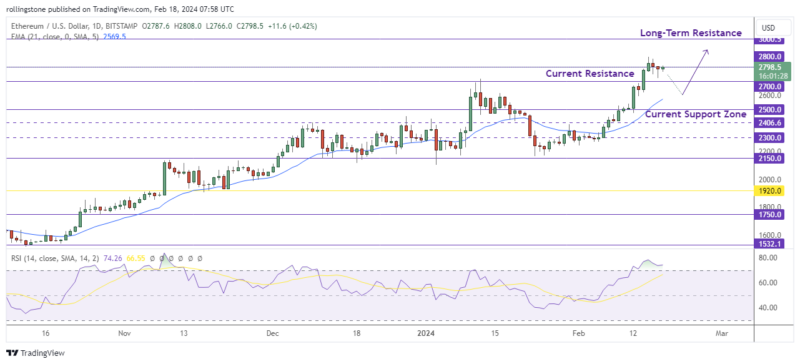
- Ethereum price is testing the pivot level at $2,800 after breaking the resistance at $2,700.
- The price might pull back between the $2.7K – $2.5K zone as the RSI signals an overbought market.
- ETH/USD can hit the long-term resistance at $3K if the chart prints a second bullish wave above the current support.
Ethereum Technical Analysis – ETH Daily Price Chart

The price of Ethereum (ETH) is probably going to drop, providing overlooked investors with another chance to purchase and postponing the $3,000 mark for a while. The horizontal line’s confluence with the channel’s midline is around $2,689 – roughly 7% below the present levels.
In the worst scenario, the price of Ethereum might pull back to the $2,600 support level, which was last seen on February 14th.
However, if bulls continue to be active, Ethereum’s price may continue to rise and surpass the range high of $2,867. In an extremely optimistic scenario, the ETH/USD might reach the psychological level of $3,000, which was last tested on April 5.


