The Distributed
  • Cryptocurrencies
    • Adoption
    • Altcoins
    • Bitcoin
    • Blockchain
    • Business
    • Decentralized Finance
    • Ethereum
    • Hacks
    • Crypto Markets
    • NFTs
    • Regulation
    • Scams
    • Stablecoins
  • Finance
    • Banking
    • Central Banks
    • Financial Markets
  • Technology
    • Artificial Intelligence
    • Cyber Security
    • Metaverse
    • Web3
  • Tools
    • Cryptocurrency Market
    • Stock Market
    • Economic Calendar
  • Archive
No Result
View All Result
The Distributed
No Result
View All Result
Home News Cryptocurrencies Bitcoin

Bitcoin and Ethereum Technical Analysis: BTC Price Surges To $48K Amid SEC ETF Approval, And The ETH to Retest $2.7K and Keep Cruising Toward $3K

by Md Ishtiaque Ahmed
February 12, 2024
in Bitcoin, Cryptocurrencies, Ethereum
BTC And ETH Technical Analysis

Our recent BTC and ETH technical analysis found Bitcoin price retests the immediate resistance at $48K and the ETH surged by 7% weekly(Source: Reddit)

Key Findings: BTC Technical Analysis

  • Bitcoin price retests the immediate resistance at $48K following the SEC ETF approval.
  • The recent price spike of Bitcoin has been fueled by significant short liquidations.
  • An extension of the current bullish trend may result in BTC/USD exceeding $58K.

Bitcoin Technical Analysis – BTC Daily Price Chart
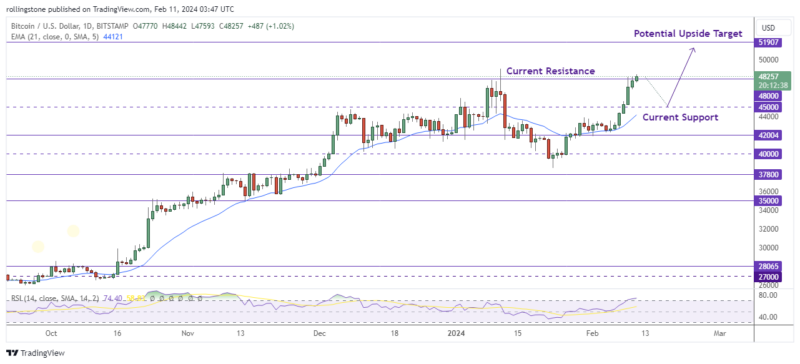
BTC/USD will likely break the resistance at $50K untouched since December 2021. Source: The Distributed

Bitcoin (BTC) jumped to around $47,450 on February 8, representing a 3.25% increase and the biggest weekly rally in four months. The price increase has raised the possibility that, in the lead-up to its impending halving event in April, Bitcoin may surpass the $50,000 barrier.

At present, the market capitalization of Bitcoin is around $47,475, and its market cap is $931.8 billion. The market may be overbought, pointing to a potential future price decline, according to the relative strength index (74.84), and the 21-day exponential moving average, which is currently at $44,137.

We’ll closely watch how the price reacts around the current resistance, which is near $48,000. The price staying above this level will mean an extension of the current bullish trend. In such a case, we may see BTC/USD exceeding the immediate resistance at $51,907 and cruising towards the $58K level.

See Related: Bitcoin And Ethereum Technical Analysis

Key Findings: ETH Technical Analysis

  • Ethereum (ETH) surged by 7% weekly, surpassing competitors and peaking at $2,700.
  • The current bullish trend may help ETH/USD pass the critical resistance zone between $3,000 – $3,500.
  • However, failure to maintain above $2,150 could lead to a decline toward support levels at $2,010 and $1,750.

Ethereum Technical Analysis – ETH Daily Price Chart
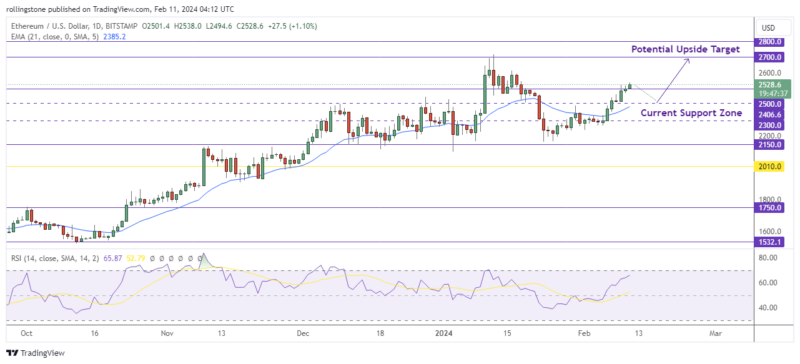
ETH/USD is to retest the immediate resistance at $2,700 following the current uptrend. Source: The Distributed

With a 7% weekly growth, Ethereum (ETH) has outperformed its competitors and demonstrated the strongest performance. The price of Ethereum (ETH) recently peaked at $2,700, and technical analysts are optimistic that ETH could soon surpass $3,500.

Ethereum (ETH) has grown significantly while trading in an area with a resistance of around $2,633 and support at $2,016. The current price rise can be related to the next Dencun update, which will improve the stability and scalability of the network.

In a bullish situation, Ethereum (ETH) would indicate more upside potential above $2,983 and $3,600 if it can exceed the resistance at $2,700.

In contrast, a bearish scenario may see ETH fall toward $2,010 and $1,750 if it fails to maintain support above the $2,150 level. This might lead to selling pressure.

Tags: Digital AssetsPrice ChartsTrade Signals

Most Read

Bitcoin

Bitcoin and Ethereum Technical Analysis: BTC Price Surges To $48K Amid SEC ETF Approval, And The ETH to Retest $2.7K and Keep Cruising Toward $3K

February 12, 2024
Cryptocurrencies

Tether Plans To Launch A US-Backed Stablecoin, Talks Ongoing

April 18, 2025
Artificial Intelligence

Top Canadian Media Outlets Sue OpenAI In Copyright Case Potentially Worth Billions

December 5, 2024
Artificial Intelligence

Introducing Deep Research: OpenAI’s Launches New Agentic Tool In ChatGPT

February 21, 2025
Cryptocurrencies

CFTC Announces Tokenization Forum With Crypto Industry Leaders

February 9, 2025

Subscribe To Our Newsletter

By subscribing, you agree with our privacy and terms.

Follow The Distributed

Twitter Instagram Youtube LinkedIn Facebook RSS
ADVERTISEMENT
The Distributed

  • About The Distributed
  • Terms
  • Contact
  • Privacy
  • Editorial
  • Careers
  • RSS Feed

© 2023 The Distributed

No Result
View All Result
  • Cryptocurrencies
    • Adoption
    • Altcoins
    • Bitcoin
    • Blockchain
    • Business
    • Decentralized Finance
    • Ethereum
    • Hacks
    • Crypto Markets
    • NFTs
    • Regulation
    • Scams
    • Stablecoins
  • Finance
    • Banking
    • Central Banks
    • Financial Markets
  • Technology
    • Artificial Intelligence
    • Cyber Security
    • Metaverse
    • Web3
  • Learn
    • The Coins
    • The Future
    • The Innovations
    • The Technology
  • Tools
    • Cryptocurrency Market
    • Stock Market
    • Economic Calendar
  • Research
  • Reviews
    • Exchanges
    • Wallets
  • Headlines
  • About Us
  • Contact Us

© 2023 The Distributed

This website uses cookies. By continuing to use this website you are giving consent to cookies being used. Visit our Privacy and Cookie Policy.