The Distributed
  • Cryptocurrencies
    • Adoption
    • Altcoins
    • Bitcoin
    • Blockchain
    • Business
    • Decentralized Finance
    • Ethereum
    • Hacks
    • Crypto Markets
    • NFTs
    • Regulation
    • Scams
    • Stablecoins
  • Finance
    • Banking
    • Central Banks
    • Financial Markets
  • Technology
    • Artificial Intelligence
    • Cyber Security
    • Metaverse
    • Web3
  • Tools
    • Cryptocurrency Market
    • Stock Market
    • Economic Calendar
  • Archive
No Result
View All Result
The Distributed
No Result
View All Result
Home News Cryptocurrencies Bitcoin

Bitcoin And Ethereum Technical Analysis: BTC Momentum Remains Neutral Near $62K, ETH Eyes A Further Price Correction Following The 50-EMA Break

by Md Ishtiaque Ahmed
October 7, 2024
in Bitcoin, Cryptocurrencies, Ethereum
Bitcoin And Ethereum Technical Analysis

Our latest technical analysis found that Bitcoin price dropped around 6% last week and Ethereum tested the support at $2.3K last week (Source: CryptoSlate)

Key Findings: BTC Technical Analysis

  • The bitcoin price dropped around 6% last week following a rejection near the $66.5K level.
  • A false break of the resistance at $64K escalated the bearish sentiment.
  • BTC price rejecting key resistance but holding above the 50-EMA suggests a neutral market momentum.

Bitcoin Technical Analysis – BTC Daily Chart

Bitcoin Technical Analysis
BTC/USD awaits a potential breakout of the $60K-$64K zone to decide the upcoming market bias. Source: The Distributed

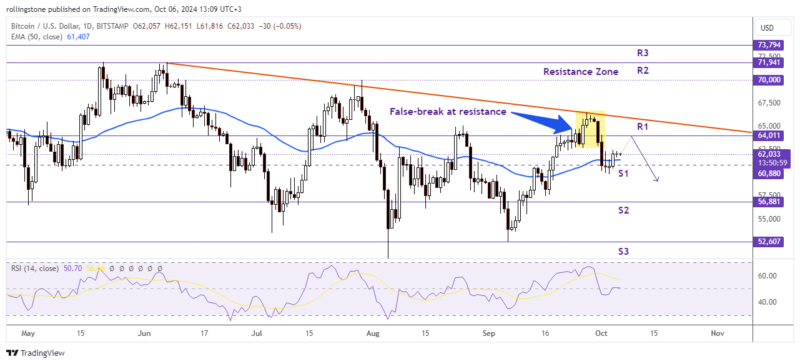
After a three-week gain in September, Bitcoin’s weekly chart indicates that the largest cryptocurrency by market capitalization is now facing resistance above $64K after testing the descending trendline, having dropped more than 6% as of Friday.

This declining trendline, which was created by joining several weekly closes since the end of March, is a crucial resistance zone since it closely corresponds with the weekly resistance near $64,011. If Bitcoin keeps losing ground, it may drop much lower and retest the upcoming weekly support at $60,863, right below the 50-day Exponential Moving Average of $61,406.

The Relative Strength Index (RSI) is indecisive among traders as it lingers around its neutral level of 50. If the RSI drops much below its neutral level, the current slump might continue.

However, there are indications of a cooling from the recent sell-off on the daily chart. Bitcoin gained support on Wednesday near $60K, which is its 200-day EMA. It is trading above $61,500 as of Friday.

Bitcoin may rally to test its 61.8% Fibonacci retracement level, which is about $62,000, if this support holds. If it closes above it, the rally might continue heading towards $70,000.

See Related: Bitcoin And Ethereum Technical Analysis: BTC Could Test The Support At $60K Despite The Current Bullish Trend

Key Findings: ETH Technical Analysis

  • Ethereum tested the support at $2.3K last week following a solid bearish breakout of the 50-EMA.
  • Since the overall trend is still bearish, ETH might pull back near $2.7K before initiating another fresh bearish move.
  • ETH/USD must survive the $2,300-$2,110 support zone to avoid a potential crash below the $2K zone.

Ethereum Technical Analysis – ETH Daily Chart

Ethereum Technical Analysis
ETH/USD might retest the critical support at $2,110 as the price rejects movements above the $2.7K resistance. Source: The Distributed

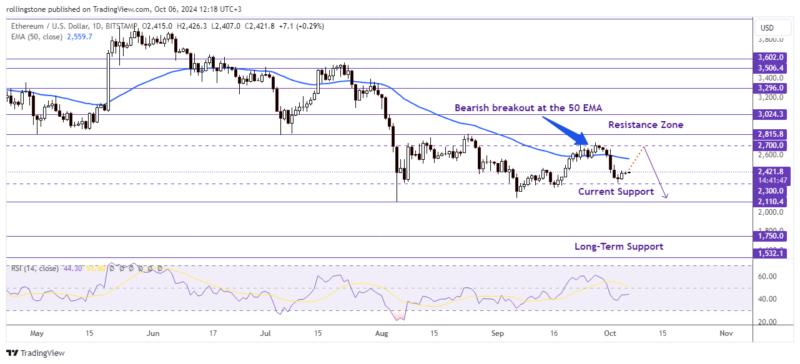
Ethereum rejected a move above the $2,700 level and eventually broke the dynamic support of the 50 EMA near $2,559 before making a strong bearish move around the current support at $2,300.

The RSI value dropping below 50 (currently at 44.11) indicates a bearish momentum. However, since the price encounters support near $2.3K, we might see ETH pullback near the $2.7K zone again before joining the overall downtrend.

Ethereum must break above the weekly resistance at $2,815 to establish bullish momentum and transform it into an uptrend. Alternatively, a bearish breakout of the $2,300 level might push the price below $2,110, initiating a long-term bearish trend.

Tags: Digital AssetsPrice ChartsTrade Signals

Most Read

Bitcoin

Bitcoin And Ethereum Technical Analysis: BTC Momentum Remains Neutral Near $62K, ETH Eyes A Further Price Correction Following The 50-EMA Break

October 7, 2024
Cryptocurrencies

Highly Anticipated Ripple Stablecoin RLUSD Launches On December 17

December 19, 2024
Research

Cryptocurrency Statistics And Insights (2022)

October 22, 2022 - Updated on November 4, 2022
Artificial Intelligence

Breaking Down Meta’s Inaugural LlamaCon 2025

May 18, 2025
Banking

StanChart Creates US-Based Team To Boost Private Equity And Hedge Fund Coverage

May 18, 2025

Subscribe To Our Newsletter

By subscribing, you agree with our privacy and terms.

Follow The Distributed

Twitter Instagram Youtube LinkedIn Facebook RSS
ADVERTISEMENT
The Distributed

  • About The Distributed
  • Terms
  • Contact
  • Privacy
  • Editorial
  • Careers
  • RSS Feed

© 2023 The Distributed

No Result
View All Result
  • Cryptocurrencies
    • Adoption
    • Altcoins
    • Bitcoin
    • Blockchain
    • Business
    • Decentralized Finance
    • Ethereum
    • Hacks
    • Crypto Markets
    • NFTs
    • Regulation
    • Scams
    • Stablecoins
  • Finance
    • Banking
    • Central Banks
    • Financial Markets
  • Technology
    • Artificial Intelligence
    • Cyber Security
    • Metaverse
    • Web3
  • Learn
    • The Coins
    • The Future
    • The Innovations
    • The Technology
  • Tools
    • Cryptocurrency Market
    • Stock Market
    • Economic Calendar
  • Research
  • Reviews
    • Exchanges
    • Wallets
  • Headlines
  • About Us
  • Contact Us

© 2023 The Distributed

This website uses cookies. By continuing to use this website you are giving consent to cookies being used. Visit our Privacy and Cookie Policy.