The Distributed
  • Cryptocurrencies
    • Adoption
    • Altcoins
    • Bitcoin
    • Blockchain
    • Business
    • Decentralized Finance
    • Ethereum
    • Hacks
    • Crypto Markets
    • NFTs
    • Regulation
    • Scams
    • Stablecoins
  • Finance
    • Banking
    • Central Banks
    • Financial Markets
  • Technology
    • Artificial Intelligence
    • Cyber Security
    • Metaverse
    • Web3
  • Tools
    • Cryptocurrency Market
    • Stock Market
    • Economic Calendar
  • Archive
No Result
View All Result
The Distributed
No Result
View All Result
Home News Cryptocurrencies Bitcoin

Bitcoin And Ethereum Technical Analysis: BTC Exceeding The 50 EMA To Initiate The Bullish Momentum Above $65K, ETH Remains In Consolidation Mode Around $3K

by Md Ishtiaque Ahmed
April 21, 2024
in Bitcoin, Cryptocurrencies, Ethereum
BTC And ETH Technical Analysis

Our latest BTC and ETH technical analysis shows Bitcoin price with 20%–25% decline while the Ethereum price initiated a breakout above 50-EMA (Source: Quora)

Key Findings: BTC Technical Analysis

  • Bitcoin’s daily chart prints a bullish candle that reflects solid demand near the support at $60,880.
  • The price already moved above the 50 EMA but still awaits RSI to exceed 50 to confirm a bullish momentum.
  • A daily candle closing above the $65K level will inspire BTC/USD to retest the supply zone around $70K – $73K.

Bitcoin Technical Analysis – BTC/USD Daily Chart

BTC/USD is growing bullish momentum above $65K which may push the price above $70K again this week. Source: The Distributed

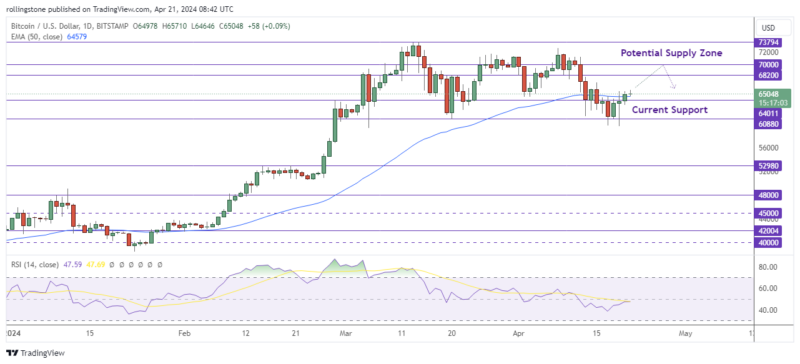
Bitcoin’s daily chart has been stabilizing between the $60K – $70K zone for the past few weeks. The rejection from the resistance at the $70K level has sent it down to the $60K support level.

BTC price severely dropped after forming a triple-top pattern, falling below its 50-day SMA. Meanwhile, the price fell to a new six-week low well below the psychological level of $60,000, only a few days before the important halves event.

The mild downward bias in the momentum indicators suggests that Bitcoin may make a comeback to its March low of 59,313. If there is a downward violation, the 52,850 resistance zone from February would be the next major support. Even lower, the 50,600 support level from February might stop additional losses.

Conversely, upward moves may drive the price up to the 64,500 April support level, which may act as future resistance. Once the bulls take control of that area, they may go for 69,000, a level that has recently served as both support and resistance. A rupture above that area might open up the 71,750-point March resistance.

In summary, following the construction of the new triple-top pattern, BTCUSD has declined toward the lower end of its range that has been in place since March. The approaching halving event determines the price’s future move.

See Related: Bitcoin, Ethereum Technical Analysis; BTC At Risk Of Hitting $23,500, But ETH Still Holds Above The Support At $1,838

Key Findings: ETH Technical Analysis

  • ETH bears failed to break the support level at $3,024 after making several attempts since 13th April.
  • The price is now testing minor resistance at $3,200 and indicating the development of short-term bullish momentum.
  • ETH/USD price still requires to break the 50 EMA resistance around $$3,284 to establish a fresh bullish trend.

Ethereum Technical Analysis – ETH/USD Daily Chart

ETH/USD shows the potential of retesting the $3.5K – $3.6K zone after rejecting a move below the support at $3,024. Source: The Distributed

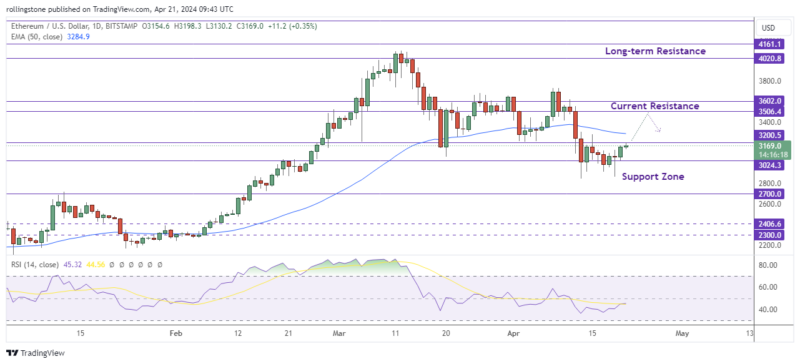
A close look at the daily chart indicates a lengthy sequence of correctional retracements that culminated with the price establishing support in a critical zone.

This range includes the large price range between $3,190 and $2,972, as well as the 100-day moving average of $3,050.

From the technical point of view, this range is important because it draws a lot of demand, which may prevent market sellers from pushing prices further lower. A slight divergence between the price and the RSI indicator also points to the possibility of a strong rebound that aims to retake the $3.5K barrier.

Even yet, a sudden break below this crucial support zone would set off a chain reaction that would push prices all the way down to the 200-day moving average, which is currently at $2.5K.

Tags: Digital AssetsPrice ChartsTrade Signals

Most Read

Bitcoin

Bitcoin And Ethereum Technical Analysis: BTC Exceeding The 50 EMA To Initiate The Bullish Momentum Above $65K, ETH Remains In Consolidation Mode Around $3K

April 21, 2024
Industry Headlines

Bybit Pay Joins the Mastercard Crypto Credential Network, Simplifying Verifiable Crypto Transfers

March 13, 2026
Business

Nexo Returns To The U.S. With $11B In Assets After Regulatory Exit

February 28, 2026
Artificial Intelligence

Introducing Gemini 2.0: Google’s Most Capable Model That Can Power AI Agents

December 19, 2024
Industry Headlines

Bybit Unveils 2025 Security Milestone: Intercepts $300M in Impersonalization, Scams and Frauds via New AI-Driven Risk Framework

February 27, 2026

Subscribe To Our Newsletter

By subscribing, you agree with our privacy and terms.

Follow The Distributed

Twitter Instagram Youtube LinkedIn Facebook RSS
ADVERTISEMENT
The Distributed

  • About The Distributed
  • Terms
  • Contact
  • Privacy
  • Editorial
  • Careers
  • RSS Feed

© 2023 The Distributed

No Result
View All Result
  • Cryptocurrencies
    • Adoption
    • Altcoins
    • Bitcoin
    • Blockchain
    • Business
    • Decentralized Finance
    • Ethereum
    • Hacks
    • Crypto Markets
    • NFTs
    • Regulation
    • Scams
    • Stablecoins
  • Finance
    • Banking
    • Central Banks
    • Financial Markets
  • Technology
    • Artificial Intelligence
    • Cyber Security
    • Metaverse
    • Web3
  • Learn
    • The Coins
    • The Future
    • The Innovations
    • The Technology
  • Tools
    • Cryptocurrency Market
    • Stock Market
    • Economic Calendar
  • Research
  • Reviews
    • Exchanges
    • Wallets
  • Headlines
  • About Us
  • Contact Us

© 2023 The Distributed

This website uses cookies. By continuing to use this website you are giving consent to cookies being used. Visit our Privacy and Cookie Policy.