The Distributed
  • Cryptocurrencies
    • Adoption
    • Altcoins
    • Bitcoin
    • Blockchain
    • Business
    • Decentralized Finance
    • Ethereum
    • Hacks
    • Crypto Markets
    • NFTs
    • Regulation
    • Scams
    • Stablecoins
  • Finance
    • Banking
    • Central Banks
    • Financial Markets
  • Technology
    • Artificial Intelligence
    • Cyber Security
    • Metaverse
    • Web3
  • Tools
    • Cryptocurrency Market
    • Stock Market
    • Economic Calendar
  • Archive
No Result
View All Result
The Distributed
No Result
View All Result
Home News Cryptocurrencies Bitcoin

Bitcoin And Ethereum Technical Analysis: BTC Bullish Rally Struggles Below The 50-EMA, ETH Could Pullback Up To $3K Before Rejoining The Downtrend

by Md Ishtiaque Ahmed
August 12, 2024
in Bitcoin, Cryptocurrencies, Ethereum
Bitcoin And Ethereum Technical Analysis

Our latest BTC and ETH technical analysis found that Bitcoin might dive below $56.8K and ETH might pull back near resistance at $3,024(Source: Bitcoi.com News)

Key Findings: BTC Technical Analysis

  • Bitcoin made a robust bullish move initiated from a false-break of the support near $52,980 last Monday.
  • However, the price already counters sell pressure below the dynamic resistance of 50-EMA.
  • We may see the BTC/USD diving below the $56.8K region once again if the price exceeds $64K this week.

Bitcoin Technical Analysis – BTC Daily Chart

BTC/USD must exceed $64K this week to avoid another potential downtrend rally. Source: The Distributed

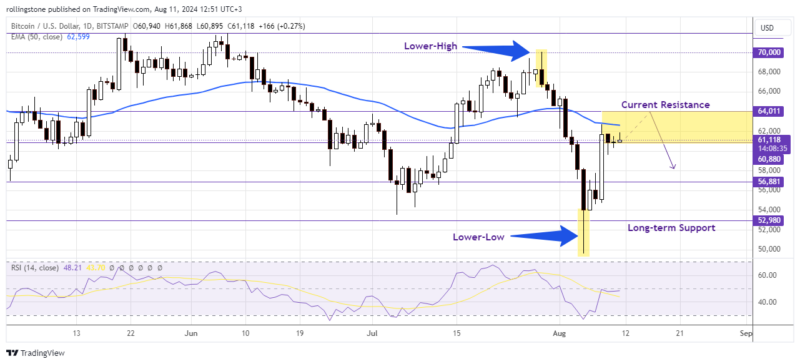
Bitcoin has made a remarkable recovery, momentarily rising beyond $60K thanks to a widespread market upswing that reversed sharp losses. This technical analysis explores the market dynamics and present trends that have contributed to Bitcoin’s comeback, as well as the significant technical obstacles it still confronts.

The immediate task for Bitcoin as it gets closer to $63,000 is to close the CME gap that has been set at that level. If this is done, it might further strengthen its recovery trajectory. But the cryptocurrency is currently negotiating a risky situation close to the 50-EMA resistance, forming a “death cross.”

Depending on the state of the market and investor attitude, Bitcoin may test more barriers above $64,000 and beyond if it can consolidate and establish support near the $62K mark.

Alternatively, a failure to break the 50-EMA resistance would signal another bearish move ahead targeting below the $50K region.

See Related: Bitcoin And Ethereum Technical Analysis: BTC Might Confirm A bullish Market Bias If The Price Closes Above $67K This Week

Key Findings: ETH Technical Analysis

  • The Ethereum daily chart indicates indecision over the next price direction as multiple inside bars printed near the weekly high.
  • Despite the overall bearish trend, the price might pull back near the key resistance at $3,024.
  • The critical support at $2,110 remains a potential downside target for Ethereum.

Ethereum Technical Analysis – ETH Daily Chart

ETH/USD might encounter a huge sell pressure inside the $2,815 – $3,024 resistance zone. Source: The Distributed

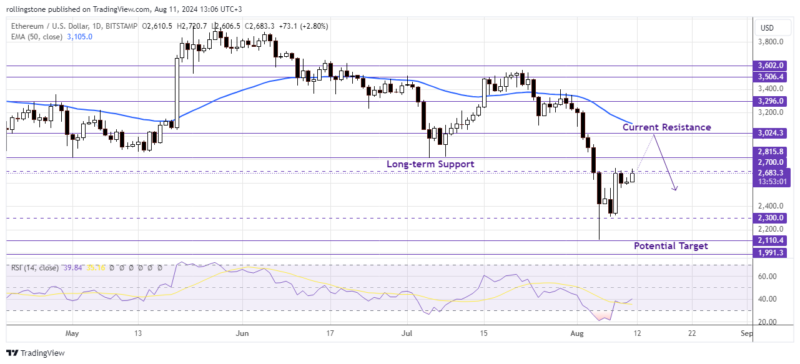
Ethereum has seen a significant decline in the past three weeks. On July 23, 2024, Ethereum traded above $3,500. It fell as low as $2,120 last week. That is a stunning 40% reduction.

The price has recovered to $2,650 since then, giving bulls some optimism. The most recent week, however, demonstrated that ETH is a risky asset that is traded on the stock market. Ethereum fell in tandem with the stock market’s collapse.

Technical research indicates to investors that there is significant resistance on Ethereum between the $2,815 and $3,024 mark. A rebound from this zone to the downside might lead the price to a further downside target near $2,110.

Tags: Digital AssetsPrice ChartsTrade Signals

Most Read

Bitcoin

Bitcoin And Ethereum Technical Analysis: BTC Bullish Rally Struggles Below The 50-EMA, ETH Could Pullback Up To $3K Before Rejoining The Downtrend

August 12, 2024
Cryptocurrencies

Highly Anticipated Ripple Stablecoin RLUSD Launches On December 17

December 19, 2024
Research

Cryptocurrency Statistics And Insights (2022)

October 22, 2022 - Updated on November 4, 2022
Artificial Intelligence

Breaking Down Meta’s Inaugural LlamaCon 2025

May 18, 2025
Banking

StanChart Creates US-Based Team To Boost Private Equity And Hedge Fund Coverage

May 18, 2025

Subscribe To Our Newsletter

By subscribing, you agree with our privacy and terms.

Follow The Distributed

Twitter Instagram Youtube LinkedIn Facebook RSS
ADVERTISEMENT
The Distributed

  • About The Distributed
  • Terms
  • Contact
  • Privacy
  • Editorial
  • Careers
  • RSS Feed

© 2023 The Distributed

No Result
View All Result
  • Cryptocurrencies
    • Adoption
    • Altcoins
    • Bitcoin
    • Blockchain
    • Business
    • Decentralized Finance
    • Ethereum
    • Hacks
    • Crypto Markets
    • NFTs
    • Regulation
    • Scams
    • Stablecoins
  • Finance
    • Banking
    • Central Banks
    • Financial Markets
  • Technology
    • Artificial Intelligence
    • Cyber Security
    • Metaverse
    • Web3
  • Learn
    • The Coins
    • The Future
    • The Innovations
    • The Technology
  • Tools
    • Cryptocurrency Market
    • Stock Market
    • Economic Calendar
  • Research
  • Reviews
    • Exchanges
    • Wallets
  • Headlines
  • About Us
  • Contact Us

© 2023 The Distributed

This website uses cookies. By continuing to use this website you are giving consent to cookies being used. Visit our Privacy and Cookie Policy.